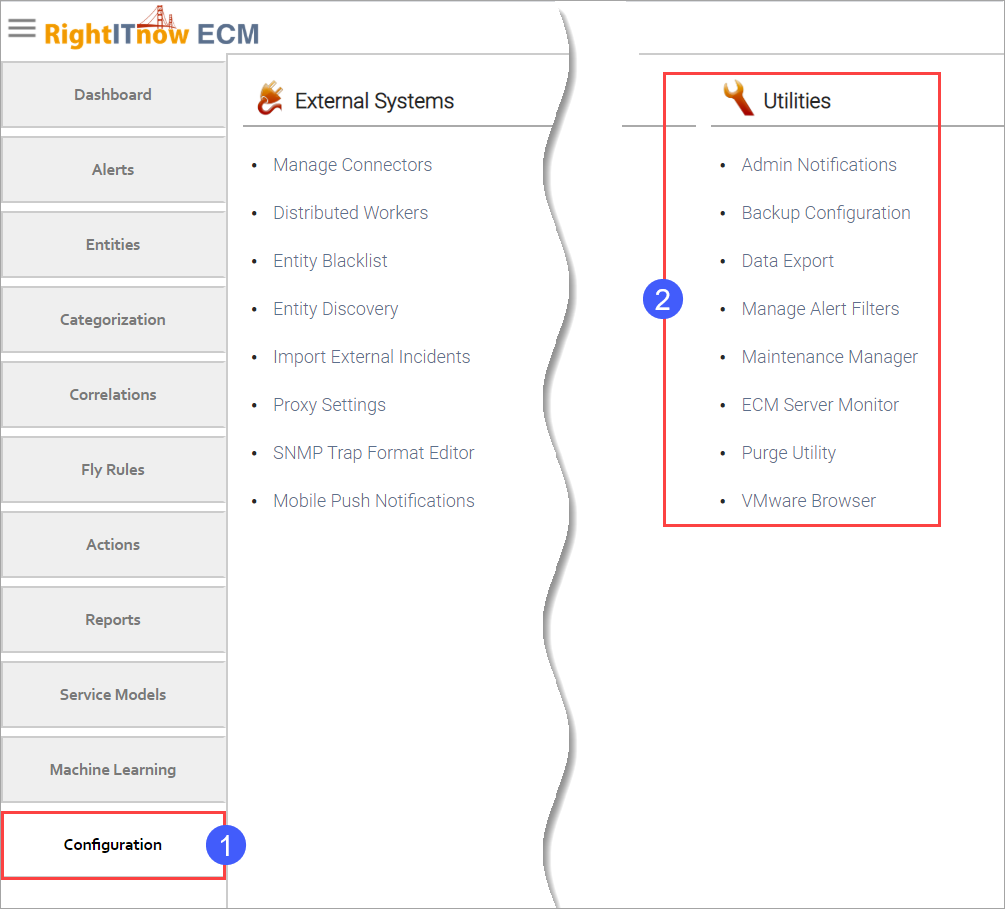
Click the Configuration tab to configure the utilities, as shown below:
You can configure a message that users will see in a popup whenever they log in. Users may dismiss the message, but it will appear upon each login until you disable the message. The message appears like this:
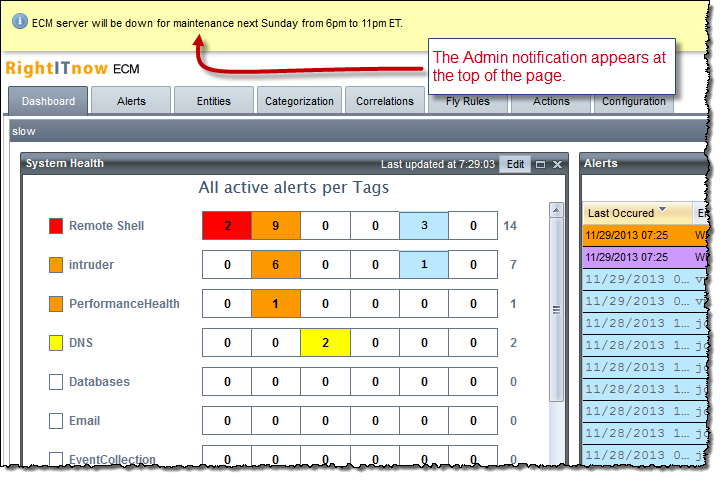
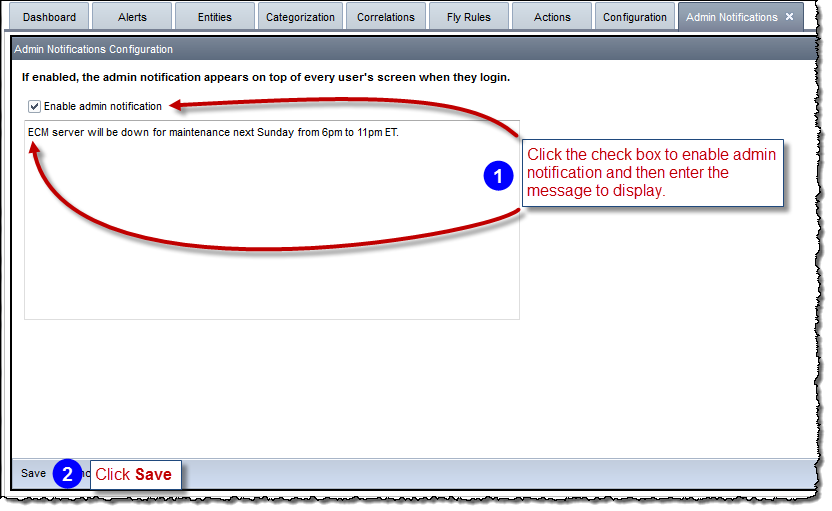
To configure the admin notification:
After you have invested the time to get RightITnow ECM configured exactly to your needs, you can backup that configuration so that you can use it in new installations without having to start all over again.
The system backs up the following configuration components:
Correlation Rules
Entity Groups Definitions
Actions and Action Groups
Application Settings (Workflow, Severities Labels, Alert Context Menu, Authentication Method, Grid and displets preferences)
Users
Alert Console’s Filters
Connectors
Users
License information
Access the Backup Configuration settings by clicking the Configuration tab and then selecting Backup Configuration from the Utilities area, as shown above.
The Backup Configuration tab appears.
You can schedule automatic backups of the RightITnow ECM configuration. You can run automatic backups with the following frequencies:
Automatic backup jobs run at midnight. The files follow the following naming convention:
configuration_backup_yyyyMMdd
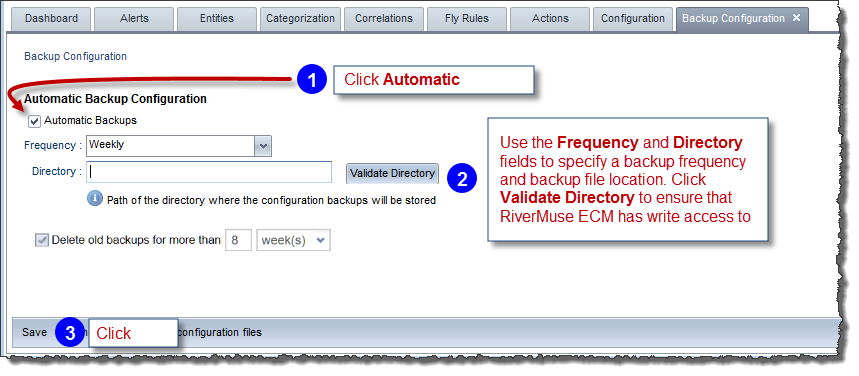
To schedule automatic backups:
Invoke the Backup Configuration tab as shown above.
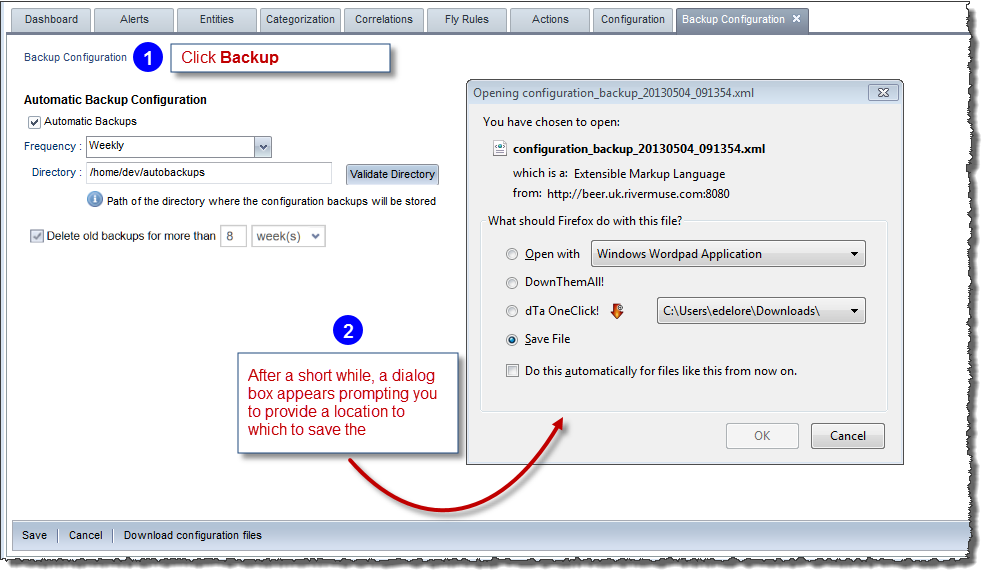
Configure automatic backups as shown below:
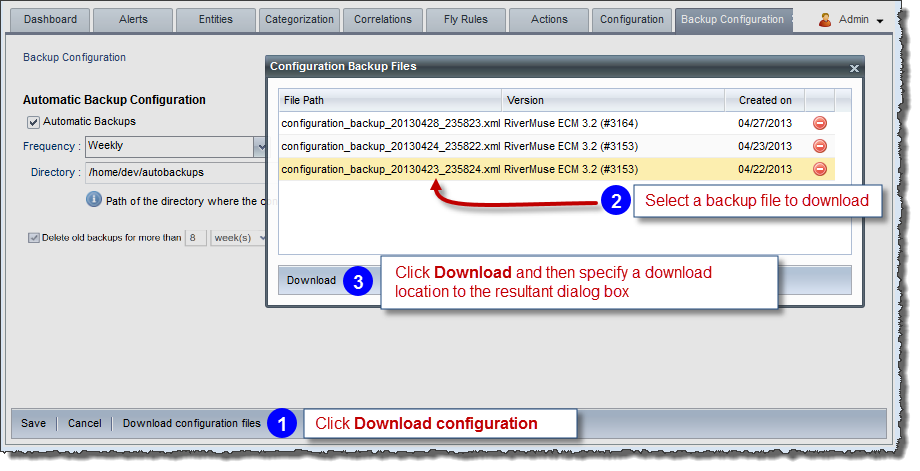
To retrieve automatic backup files:
Invoke the Backup Configuration tab as shown above.
Retrieve the automatic backup files as shown below:
You can only restore the configuration to a clean database. The option to restore the RightITnow ECM configuration appears after the user has configured the database during an installation of RightITnow ECM:
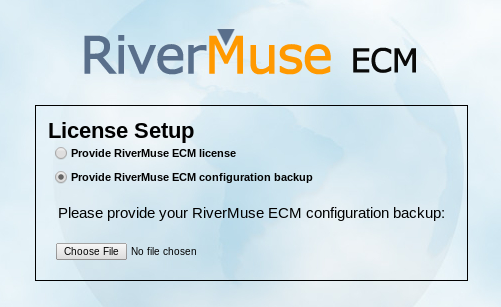
Once you have selected the configuration backup file, the system restores the configuration components automatically and you can log back in to RightITnow ECM.
Note: Solarwinds connectors will be undeployed. You need to validate the connection to get the certificate before deploying them again.
See the RightITnow ECM Installation Guide for more details on running the RightITnow Installation program that affords you access to the option to restore the RightITnow configuration.
To delete old backup files:
Invoke the Backup Configuration tab as shown above.
Use the delete backups controls to configure the purge interval:

Click Save.
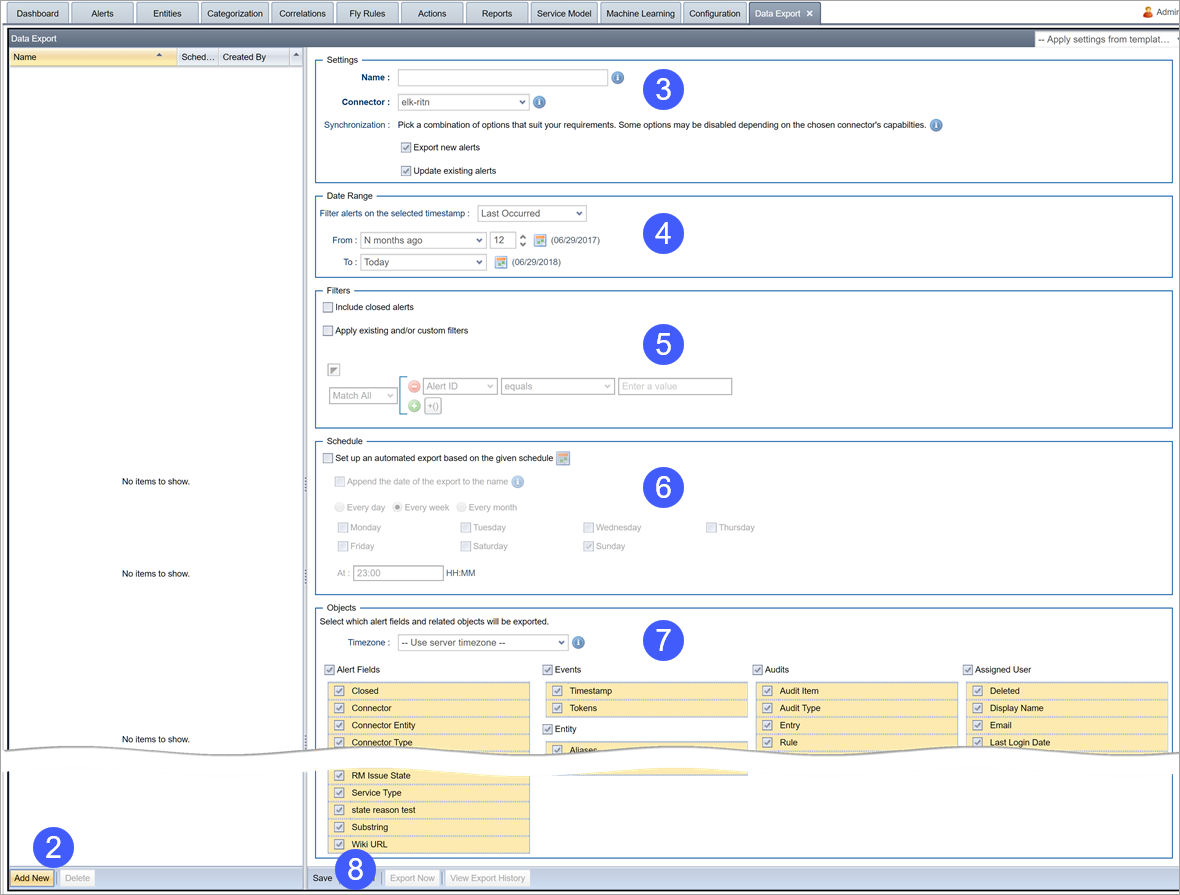
You can configure regular export of highly configurable data sets for use and analysis by external systems such as Elasticsearch. The general process is:
To configure data export:
There are two ways to monitor the ECM server:
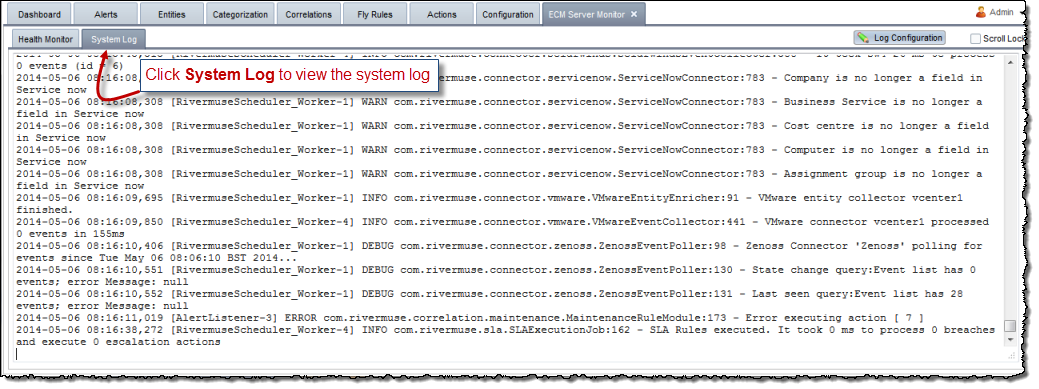
You can also view and configure the System log using the ECM Health Monitor.
RightITnow allows for polling of the RightITnow ECM server health statistics through a JSON API. These statistics are updated internally every 6 seconds. No special configuration is necessary to enable this feature. The URL to access the statistics is http://<RightITnow url>/rightitnow/api/health/getstats. The following is an example of the JSON object that is returned:
{"rmHealthStats":{"stats":[{"name":"Event Queue","value":0},{"name":"Alert Queue","value":0},{"name":"Event Average Enqueue Time","value":0},{"name":"Alert Average Enqueue Time","value":0},{"name":"HTTP Connection Count","value":2},{"name":"Thread Count","value":36},{"name":"Heap Memory Usage","value":93681584}]}}
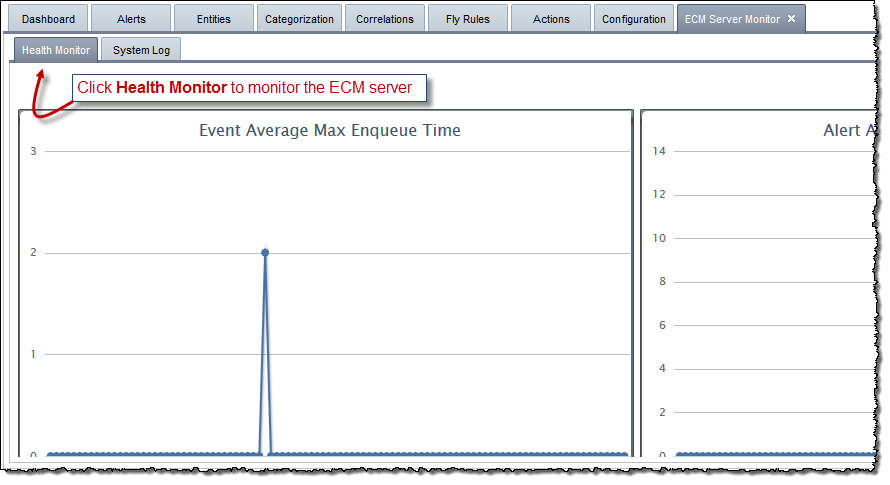
To monitor using the Health Monitor:
The ECM Server Monitor tab appears.
Click the Health Monitor tab to monitor the ECM server:
You can export health monitor readings to a log.
To set up health monitor logging:
Access the Health Monitor as described in Monitoring Using the Health Monitor.
Click Health
Monitor Logging Configuration.
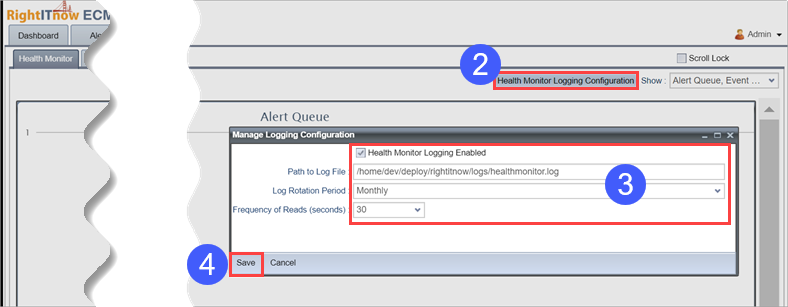
Configure the export fields.
Click Save.
To view and configure the System log:
The ECM Server Monitor tab appears.
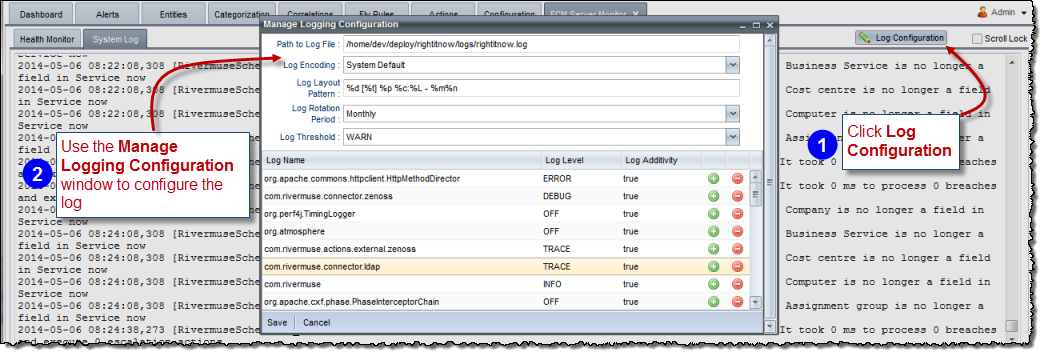
The Manage Logging Configuration window offers the following settings:
Path to Log File - The full path of the log file.
Log Encoding - The character encoding used for the log. The default encoding matches the encoding of the system where ECM is installed.
Log Layout Pattern - The Log4j layout pattern. A complete explanation of how to use this can be found in: http://logging.apache.org/log4j/1.2/apidocs/org/apache/log4j/PatternLayout.html
Log Rotation Period - Log can be rotated Monthly or daily.
Log Threshold - The appender will ignore any logging with level lower than the one setup as the threshold. The available logging levels are (from lower to higher) TRACE -> DEBUG -> INFO -> WARN -> ERROR -> FATAL
The grid - The logger grid displays logger names in the form of java packages, as defined by log4j. Each logger can have a log level and an additivity. If a log level set for an individual logger is lower than the threshold, then any log message from this logger which is lower than the threshold is ignored.
If additivity is set to true by default, then children inherit the appenders of their ancestors by default. If this variable is set to false, then the appenders found in the ancestors of this logger are not used. However, the children of this logger will inherit its appenders, unless the children have their additivity flag set to false also.
You can purge closed alerts, event records for alerts, audit records, SLA breaches, incident records, entities, and maintenance window records, which may enhance performance and free up disk space.
To access the Purge Utility:
Click the Configuration tab at the top of the RightITnow ECM screen.
Click Purge Utility in the Utilities section. The Purge Utility tab appears.
Use the controls on the left to configure the purge schedule for closed alerts, event records for alerts, audit records, SLA breaches, incident records, and maintenance window records, and then click Save.
Note: Use the View/Edit Filter button to fine tune the records eligible for purging in the purge alerts sections and the Purge Incident Records sections.
Click View Purge Schedule to view the corresponding schedule. You can view statistics from the last purge and the upcoming purge schedules on the right. Click Approximate time taken for next scheduled run to see an estimate of required time for the next run. Click Restore RightITnow Default should you want to revert to the default settings. Click Interrupt Alert Purging to stop the current purge job.
You can create, schedule and download reports on alerts data. You can report on general alerts data, on how long an alert stayed in a particular state during a period of time, and on SLA breached alerts.
Note: ECM uses the double quote character (") to escape commas when exporting the report to a CSV file.
To create reports:
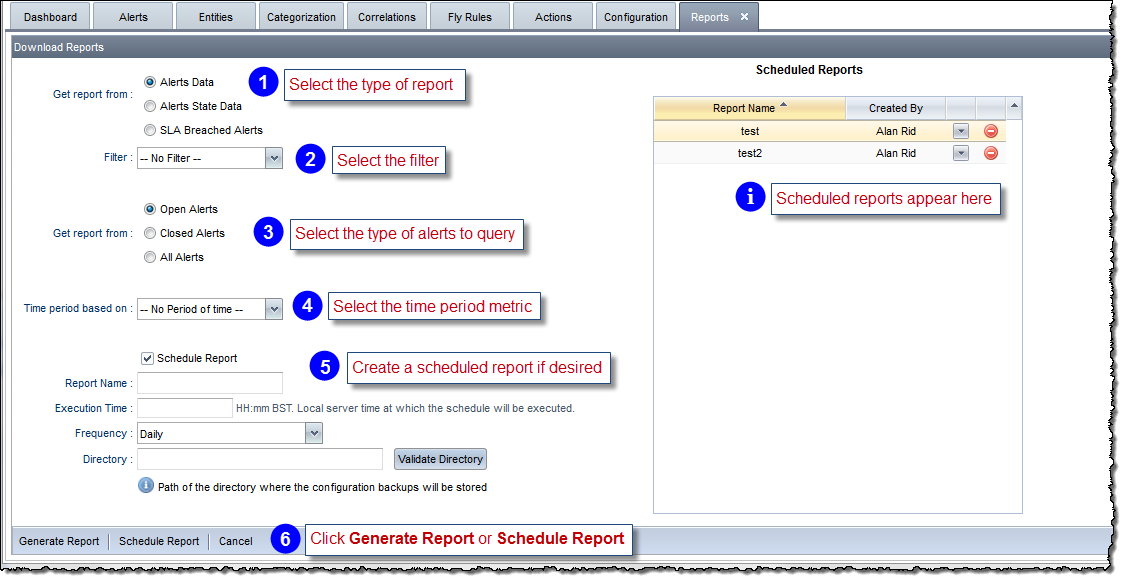
The Alerts Data report provides the following information:
Alert ID
Entity Name
Entity Group
Sev
Priority
Description
Count
First Occurred
Last Occurred
Last Touched
Last Reset
Last Reset Count
user
Connector
Connector Entity
Tags
State
Closed
In Maintenance
State Last Touched
Owner Last Touched
Incident Number
Incident Status
Incident Opened
Incident Closed
Connector Type
Substring
Company
Business Service
RM DM CustomIndicator
Cost centre
Project Roles
Service Type
Computer
Wiki URL
Customer
Disk Space
Nagios Free Space
Nagios Free Space Percentage
Nagios inode Percentage
IRC Channel
State Reason
Assignment group
Project Key
User Group
Breached Rules
The Alerts State Data report provides the following information:
Alert ID
State Value
Timestamp
The SLA Breached Alerts report provides the following information:
Alert ID
Entity Name
Entity Group
Sev
Priority
Description
Count
First Occurred
Last Occurred
Last Touched
Last Reset
Last Reset Count
user
Assigned Group
Connector
Connector Entity
Tags
State
Closed
In Maintenance
State Last Touched
Owner Last Touched
Incident Number
Incident Status
Incident Opened
Incident Closed
Connector Type
Substring
Company
Business Service
RM DM CustomIndicator
Cost centre
Project Roles
Service Type
Computer
Wiki URL
Customer
Disk Space
Nagios Free Space
Nagios Free Space Percentage
Nagios inode Percentage
IRC Channel
State Reason
Assignment group
Project Key
date test
User Group
SLA Rule
SLA State
SLA Owner
Date Counted From
First Executed Time
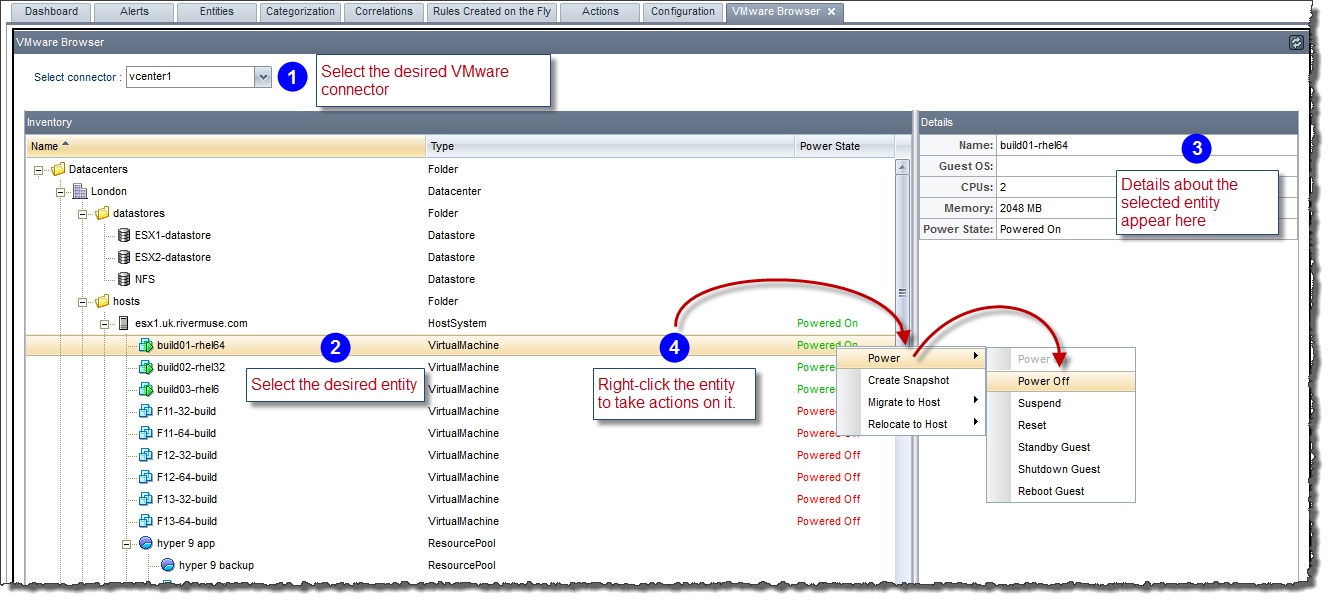
RightITnow ECM offers a VMware Browser you can use to view your virtual environment's topology and details, and execute actions on your virtual entities.
To use the VMware Browser:
Select VMware Browser from the Utilities section of the Configuration tab.
The VMware Browser tab appears.
Use the VMware Browser as described below: